This part gets all lease the DHCP server and does not care where in the range they are.[:len [/ip dhcp-server lease find where server=$dname]]
No problem. You have not done anything wrong, just in another way.Sorry to waste your time over this!
This is interesting. CSV is perfect, and better than json since its smaller.I'm currently playing around with the PMACCT-packages and writing out some CSV-style files. (other formats possible too like json)
Should be pretty straightforward but it depends a bit on what we want to achieve. Let's say for Netflow v9, Splunk created following ready-to-use fields.Have not had time to look at much yet, but it look possible som complicated to set up. It have to much possibility, not sure of saved format is ok.
I would like a small program that listen for netflow and save them one line at a time. Then Splunk can index it.
System we have to day with just sending accounting data using syslog with rest of the data works quick and easy and no need for extra port etc.
But I will investigate it and see if its the road to go.
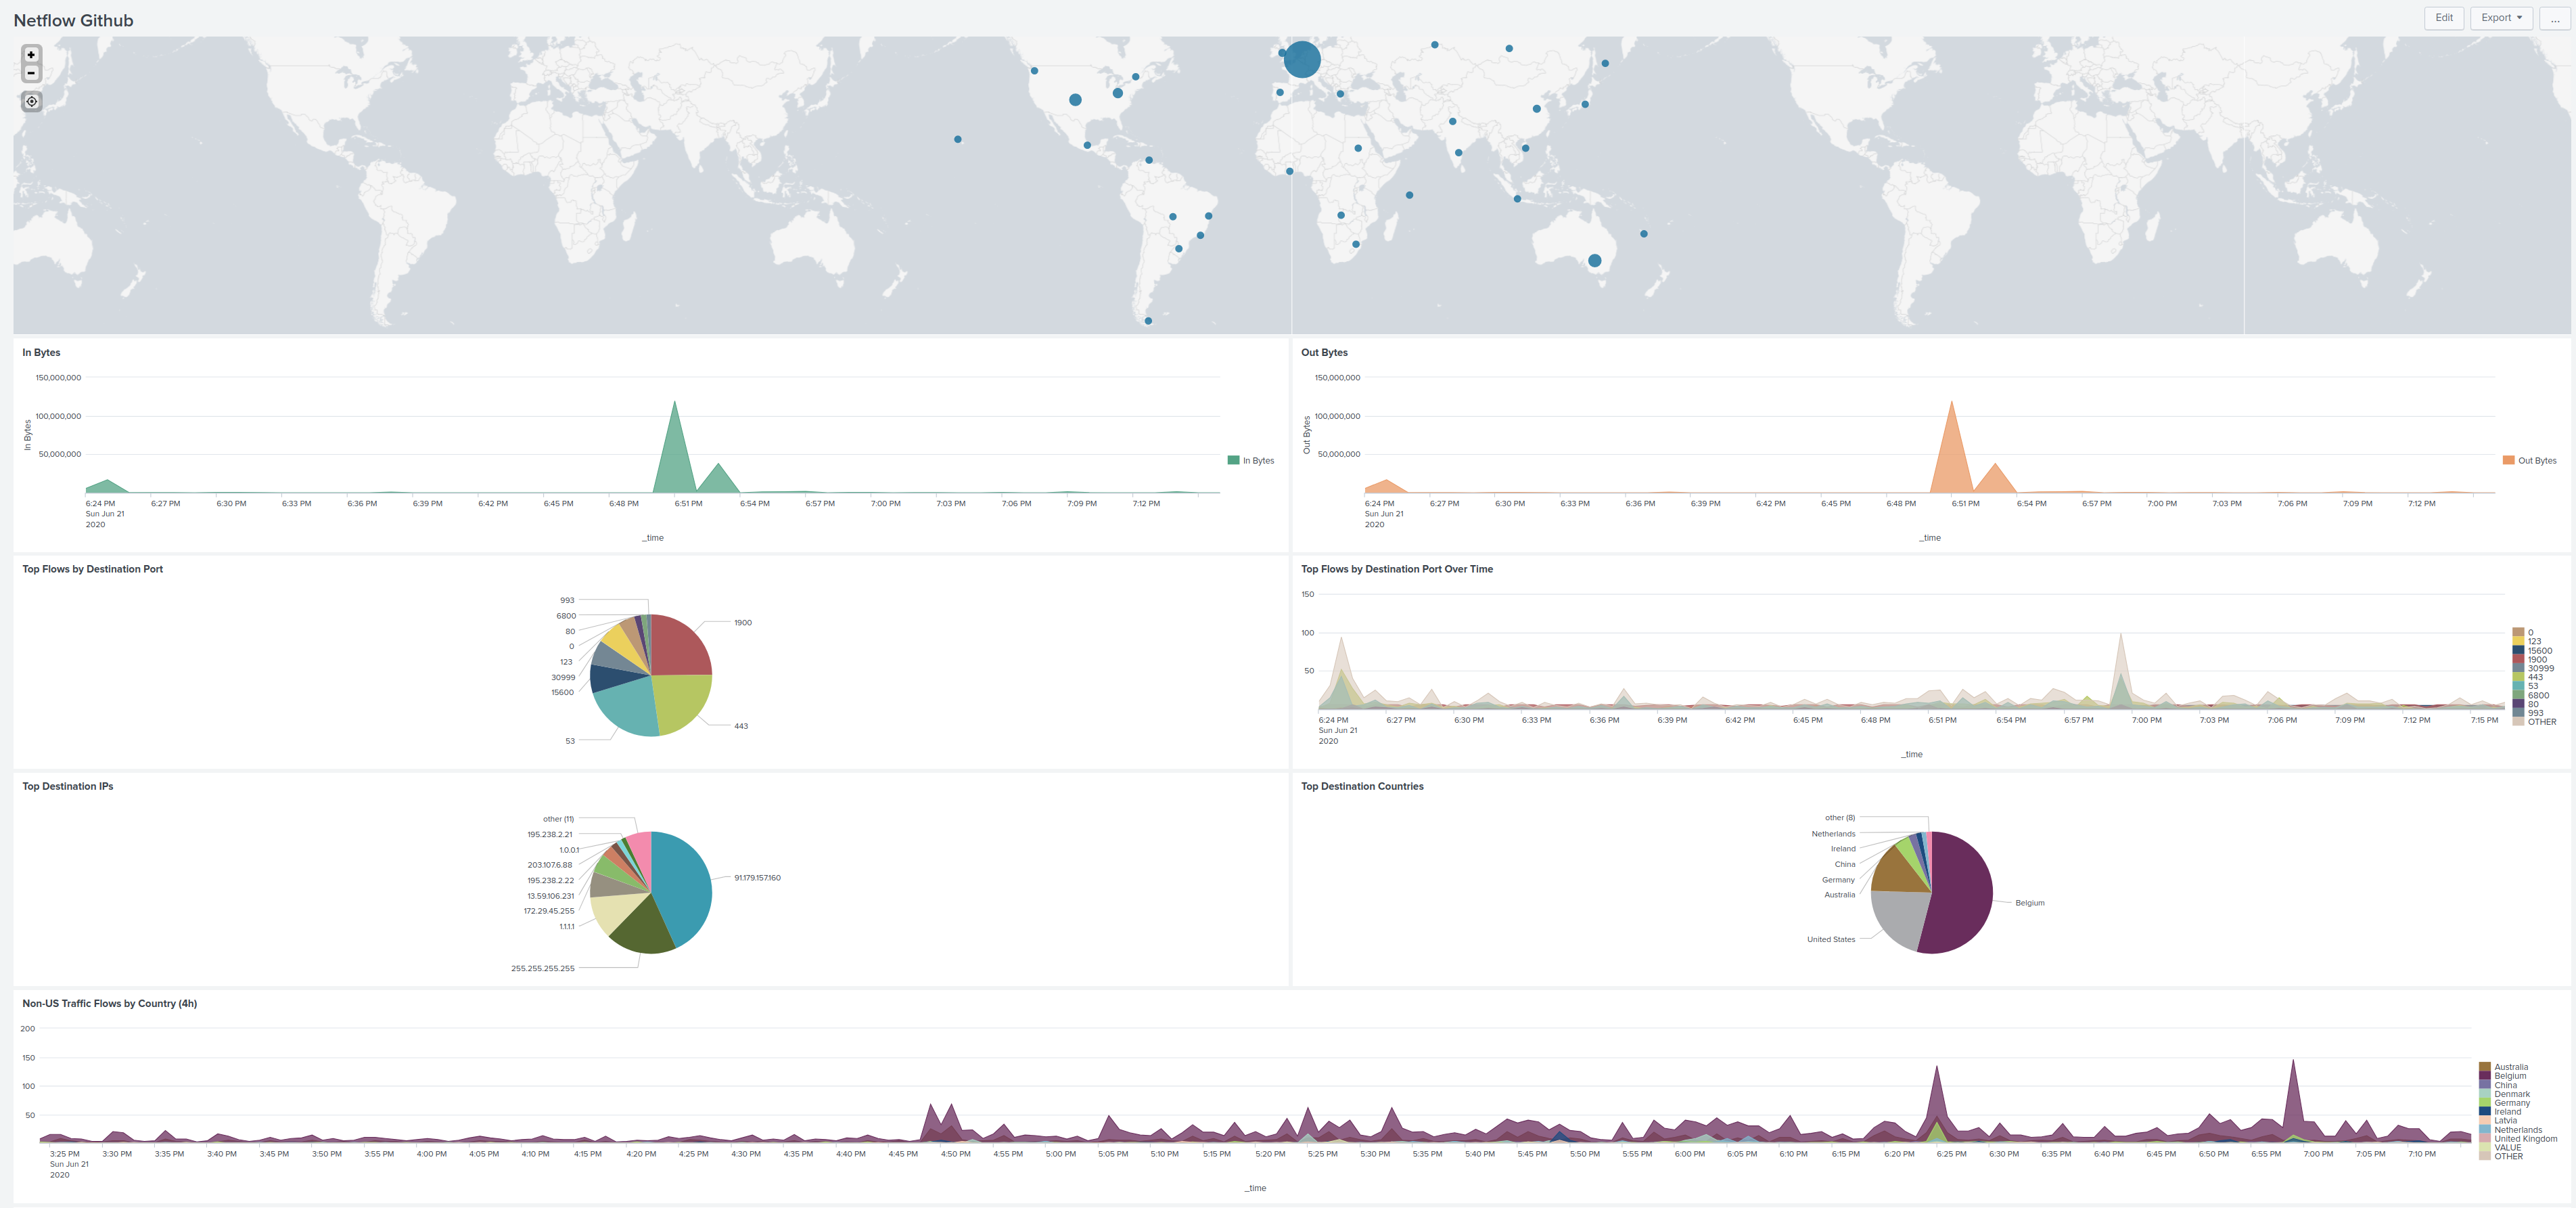
On the dashboard/XML I posted ? Because I did that, since there is no "bytes_out" I simply put for temporary the same "bytes_in" alsoin bytes og out bytes shows the same data, just renamed name
Good analysis. I think that is correct. I'm now testing with hairpin-NAT session and indeed input_snmpidx = output_snmpidx (in my case value of 15) which is my "WAN" with public IPMaybe this should be an add on module for the MikroTik app since it would involve lots of extra stuff.
Using wan IP as a trigger is not good enough, since this will change for many user and then you need to have some sort of auto update.
But after looking at input_snmpidx and output_snmpidx (input/output SNMP interface index) we may have a solution on how this works.
input_snmpidx=2 output_snmpidx=1 Traffic going from inside to outside host
input_snmpidx=1 output_snmpidx=2 Traffic returning from outside host
input_snmpidx=2 output_snmpidx=2 Traffic going from inside oust to inside server using hairpin nat
This may be wrong, but I think I am no correct track.
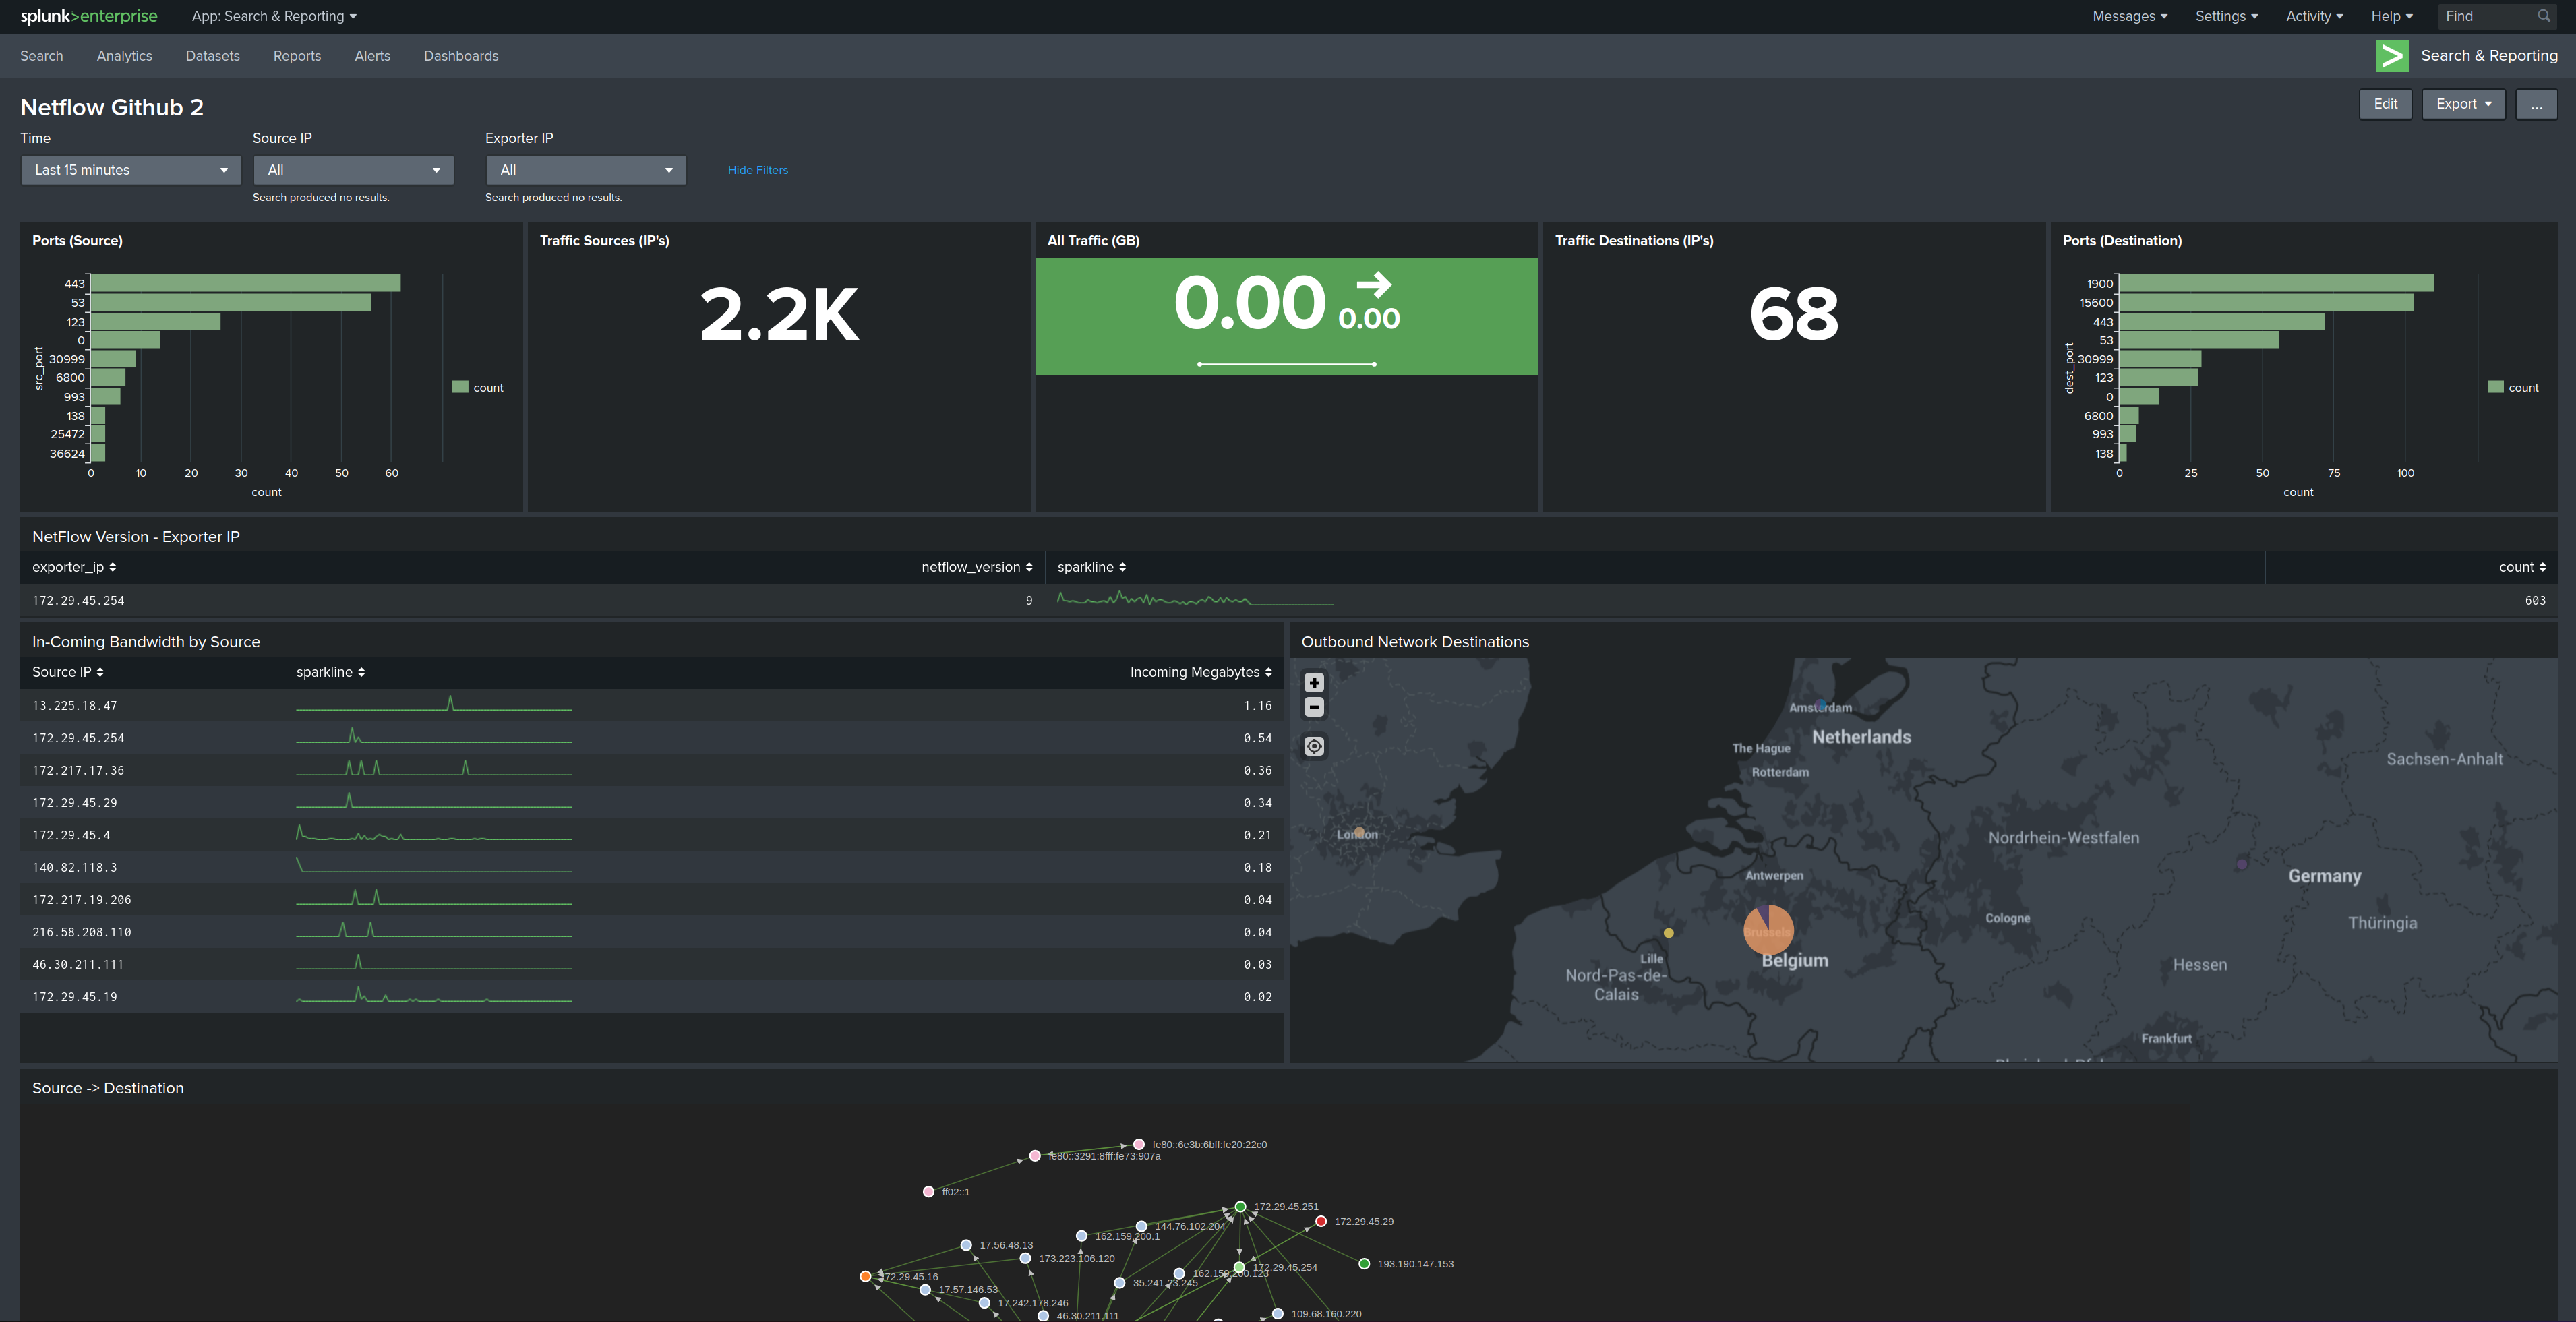
I did tested the dashboard from git and they work fine. But I think they also mix whats source and destination port. I can see that 443 is top on both source port and dest post, they are part of returning packets when your request that it will go back to the same port.
in bytes og out bytes shows the same data, just renamed name
snmpwalk -v2C -c public 10.10.10.1 ifname
IF-MIB::ifName.1 = STRING: ether1
IF-MIB::ifName.2 = STRING: Bridge1
IF-MIB::ifName.3 = STRING: ether3
IF-MIB::ifName.4 = STRING: ether4
IF-MIB::ifName.5 = STRING: ether5
IF-MIB::ifName.6 = STRING: pptp-in1
IF-MIB::ifName.8 = STRING: ether2
IF-MIB::ifName.12 = STRING: VLAN20
/interface print
Flags: D - dynamic, X - disabled, R - running, S - slave
# NAME TYPE ACTUAL-MTU L2MTU MAX-L2MTU MAC-ADDRESS
0 R ;;; WAN
ether1 ether 1500 1596 2026 6C:3B:6B:88:34:3E
1 RS ;;; Cisco C3560CX
ether2 ether 1500 1596 2026 6C:3B:6B:88:34:3F
2 S ;;; Test VLAN 20
ether3 ether 1500 1596 2026 6C:3B:6B:88:34:40
3 RS ;;; Windows server
ether4 ether 1500 1596 2026 6C:3B:6B:88:34:41
4 RS ;;; Linux server
ether5 ether 1500 1596 2026 6C:3B:6B:88:34:42
5 R ;;; Main Bridge
Bridge1 bridge 1500 1596 6C:3B:6B:88:34:3F
6 R ;;; Sokkel
VLAN20 vlan 1500 1592 6C:3B:6B:88:34:3F
7 pptp-in1 pptp-in
[xxxx] > /interface print oid
Flags: D - dynamic, X - disabled, R - running, S - slave
0 R ;;; WAN
name=.1.3.6.1.2.1.2.2.1.2.1 actual-mtu=.1.3.6.1.2.1.2.2.1.4.1 mac-address=.1.3.6.1.2.1.2.2.1.6.1 admin-status=.1.3.6.1.2.1.2.2.1.7.1 oper-status=.1.3.6.1.2.1.2.2.1.8.1 bytes-in=.1.3.6.1.2.1.31.1.1.1.6.1
packets-in=.1.3.6.1.2.1.31.1.1.1.7.1 discards-in=.1.3.6.1.2.1.2.2.1.13.1 errors-in=.1.3.6.1.2.1.2.2.1.14.1 bytes-out=.1.3.6.1.2.1.31.1.1.1.10.1 packets-out=.1.3.6.1.2.1.31.1.1.1.11.1
discards-out=.1.3.6.1.2.1.2.2.1.19.1 errors-out=.1.3.6.1.2.1.2.2.1.20.1
1 RS ;;; Cisco C3560CX
name=.1.3.6.1.2.1.2.2.1.2.8 actual-mtu=.1.3.6.1.2.1.2.2.1.4.8 mac-address=.1.3.6.1.2.1.2.2.1.6.8 admin-status=.1.3.6.1.2.1.2.2.1.7.8 oper-status=.1.3.6.1.2.1.2.2.1.8.8 bytes-in=.1.3.6.1.2.1.31.1.1.1.6.8
packets-in=.1.3.6.1.2.1.31.1.1.1.7.8 discards-in=.1.3.6.1.2.1.2.2.1.13.8 errors-in=.1.3.6.1.2.1.2.2.1.14.8 bytes-out=.1.3.6.1.2.1.31.1.1.1.10.8 packets-out=.1.3.6.1.2.1.31.1.1.1.11.8
discards-out=.1.3.6.1.2.1.2.2.1.19.8 errors-out=.1.3.6.1.2.1.2.2.1.20.8
2 S ;;; Test VLAN 20
name=.1.3.6.1.2.1.2.2.1.2.3 actual-mtu=.1.3.6.1.2.1.2.2.1.4.3 mac-address=.1.3.6.1.2.1.2.2.1.6.3 admin-status=.1.3.6.1.2.1.2.2.1.7.3 oper-status=.1.3.6.1.2.1.2.2.1.8.3 bytes-in=.1.3.6.1.2.1.31.1.1.1.6.3
packets-in=.1.3.6.1.2.1.31.1.1.1.7.3 discards-in=.1.3.6.1.2.1.2.2.1.13.3 errors-in=.1.3.6.1.2.1.2.2.1.14.3 bytes-out=.1.3.6.1.2.1.31.1.1.1.10.3 packets-out=.1.3.6.1.2.1.31.1.1.1.11.3
discards-out=.1.3.6.1.2.1.2.2.1.19.3 errors-out=.1.3.6.1.2.1.2.2.1.20.3
3 RS ;;; Balder Windows server
name=.1.3.6.1.2.1.2.2.1.2.4 actual-mtu=.1.3.6.1.2.1.2.2.1.4.4 mac-address=.1.3.6.1.2.1.2.2.1.6.4 admin-status=.1.3.6.1.2.1.2.2.1.7.4 oper-status=.1.3.6.1.2.1.2.2.1.8.4 bytes-in=.1.3.6.1.2.1.31.1.1.1.6.4
packets-in=.1.3.6.1.2.1.31.1.1.1.7.4 discards-in=.1.3.6.1.2.1.2.2.1.13.4 errors-in=.1.3.6.1.2.1.2.2.1.14.4 bytes-out=.1.3.6.1.2.1.31.1.1.1.10.4 packets-out=.1.3.6.1.2.1.31.1.1.1.11.4
discards-out=.1.3.6.1.2.1.2.2.1.19.4 errors-out=.1.3.6.1.2.1.2.2.1.20.4
4 RS ;;; Varg Linux server
name=.1.3.6.1.2.1.2.2.1.2.5 actual-mtu=.1.3.6.1.2.1.2.2.1.4.5 mac-address=.1.3.6.1.2.1.2.2.1.6.5 admin-status=.1.3.6.1.2.1.2.2.1.7.5 oper-status=.1.3.6.1.2.1.2.2.1.8.5 bytes-in=.1.3.6.1.2.1.31.1.1.1.6.5
packets-in=.1.3.6.1.2.1.31.1.1.1.7.5 discards-in=.1.3.6.1.2.1.2.2.1.13.5 errors-in=.1.3.6.1.2.1.2.2.1.14.5 bytes-out=.1.3.6.1.2.1.31.1.1.1.10.5 packets-out=.1.3.6.1.2.1.31.1.1.1.11.5
discards-out=.1.3.6.1.2.1.2.2.1.19.5 errors-out=.1.3.6.1.2.1.2.2.1.20.5
5 R ;;; Main Bridge
name=.1.3.6.1.2.1.2.2.1.2.2 actual-mtu=.1.3.6.1.2.1.2.2.1.4.2 mac-address=.1.3.6.1.2.1.2.2.1.6.2 admin-status=.1.3.6.1.2.1.2.2.1.7.2 oper-status=.1.3.6.1.2.1.2.2.1.8.2 bytes-in=.1.3.6.1.2.1.31.1.1.1.6.2
packets-in=.1.3.6.1.2.1.31.1.1.1.7.2 discards-in=.1.3.6.1.2.1.2.2.1.13.2 errors-in=.1.3.6.1.2.1.2.2.1.14.2 bytes-out=.1.3.6.1.2.1.31.1.1.1.10.2 packets-out=.1.3.6.1.2.1.31.1.1.1.11.2
discards-out=.1.3.6.1.2.1.2.2.1.19.2 errors-out=.1.3.6.1.2.1.2.2.1.20.2
6 R ;;; Sokkel
name=.1.3.6.1.2.1.2.2.1.2.12 actual-mtu=.1.3.6.1.2.1.2.2.1.4.12 mac-address=.1.3.6.1.2.1.2.2.1.6.12 admin-status=.1.3.6.1.2.1.2.2.1.7.12 oper-status=.1.3.6.1.2.1.2.2.1.8.12
bytes-in=.1.3.6.1.2.1.31.1.1.1.6.12 packets-in=.1.3.6.1.2.1.31.1.1.1.7.12 discards-in=.1.3.6.1.2.1.2.2.1.13.12 errors-in=.1.3.6.1.2.1.2.2.1.14.12 bytes-out=.1.3.6.1.2.1.31.1.1.1.10.12
packets-out=.1.3.6.1.2.1.31.1.1.1.11.12 discards-out=.1.3.6.1.2.1.2.2.1.19.12 errors-out=.1.3.6.1.2.1.2.2.1.20.12
7 name=.1.3.6.1.2.1.2.2.1.2.6 actual-mtu=.1.3.6.1.2.1.2.2.1.4.6 mac-address=.1.3.6.1.2.1.2.2.1.6.6 admin-status=.1.3.6.1.2.1.2.2.1.7.6 oper-status=.1.3.6.1.2.1.2.2.1.8.6 bytes-in=.1.3.6.1.2.1.31.1.1.1.6.6
packets-in=.1.3.6.1.2.1.31.1.1.1.7.6 discards-in=.1.3.6.1.2.1.2.2.1.13.6 errors-in=.1.3.6.1.2.1.2.2.1.14.6 bytes-out=.1.3.6.1.2.1.31.1.1.1.10.6 packets-out=.1.3.6.1.2.1.31.1.1.1.11.6
discards-out=.1.3.6.1.2.1.2.2.1.19.6 errors-out=.1.3.6.1.2.1.2.2.1.20.6
line _time src_ip s_port dest_ip d_port next_ip byte pacet prot in_if out_if
1 2020-06-23 10:50:11.280 193.212.a.a 42744 92.220.b.b 514 10.10.10.50 3903 35 17 1 2 0
2 2020-06-23 10:50:00.570 193.212.a.a 22 92.220.b.b 55774 10.10.10.32 1312380 2191 6 1 2 24
3 2020-06-23 10:50:00.540 10.10.10.32 55774 193.212.a.a 22 92.220.200.1 1074672 9631 6 2 1 24
Hmm, to get some accounting in place I don't think the what-packets-are-part-of-what-session is really helpfull/important. You only need to make sure that those flow-records within that time-frame (eg. per 60-second , 300-second) are grouped & counted together to get some IN / OUT "totals".After talking more than one hour with a super spesialist in Netflow, I do start to get the grip on how things works.
There are no way you can se in a Netflow packets, if its traffic returning from an started inside session or if it some from outside starting to sending inn data. You can look at ports and say that all ports below 1024 are destination ports, rest are source port. This will help some but will fail for all application using high ports like Minecraft that uses port 25565 as default listening port.
What you can see with Netflow is how much traffic going inn or out and from what IP to what IP. Ports however are not solvable.
I would not say that, in a previous project we had a global deployed Riverbed solution with a very large Netflow collector appliance (taking in millions of flows per day from over the whole globe)What you can see with Netflow is how much traffic going inn or out and from what IP to what IP. Ports however are not solvable.
Where is version 4.1??, i only see ver 4.0 on the OP.Script updated to 4.1 to get CAPsMANN inforamtion.
Read section 2f) if you like to use CAPsMANN function.
FixedWhere is version 4.1??, i only see ver 4.0 on the OP.
and this code on the script:Splunk for MikroTik updated to v3.1
Mayor changes is the CAPsMAN view
If you like to use the CAPsMAN, update script to 4.1 and add capsmann script fond in section 2f first post:
# Test if CAPsMANN is installed, if yes, run it
# ----------------------------------
:do {
:if ([:len [/caps-man registration-table find]] > 0 and $CAPsMANN) do={
/system script run capsman
}
} on-error={}
I'm actually have my splunk environment on docker working perfectly.Hello Jotne,
Have you ever considered using a dockerized Splunk Environment?
I lately tested this but did not get any mikrotik information in Splunk.
My "normal" Splunk envirnoment is working.
do you use the official Splunk image?I'm actually have my splunk environment on docker working perfectly.
Inviato dal mio SM-G950F utilizzando Tapatalk
docker run -d --net host -v /volume3/docker/Splunk/etc:/opt/splunk/etc -v /volume3/docker/Splunk/var:/opt/splunk/var -v /etc/localtime:/etc/localtime:ro -e "SPLUNK_START_ARGS=--accept-license" -e "SPLUNK_PASSWORD=Password" --name splunk splunk/splunk:latest
I do not see those files on my disk. Can you download one of them to your PC and list whats in the file?is there a way to make the script output not be reflected on the memory or disk log?, only send it to the remote splunk server?
Should work as long as data gets inn to Splunk and are tagged correctly "MikroTik"Thank you I going to try this somewhere in the next day's.
the files are showing on my disk because i have a rule that send the logs there, we need to analyze some things on the logs for my isp, but the script is making the logs grow a lot in size,I do not see those files on my disk. Can you download one of them to your PC and list whats in the file?is there a way to make the script output not be reflected on the memory or disk log?, only send it to the remote splunk server?
/system logging action
add disk-file-count=31 disk-file-name=disk1/logs/log disk-lines-per-file=8192 \
name=disk1 target=disk
/system logging
set 3 action=memory
add action=disk1 topics=critical
add action=disk1 topics=error
add action=disk1 topics=info
add action=disk1 topics=warning
add action=disk1 topics=wireless,debug
add action=disk1 topics=e-mail,debug
add action=disk1 topics=caps,debug
You have selected to write the logs to your disk so it will write it there. I do not understand the problem. Just remove the log to the disk?the files are showing on my disk because i have a rule that send the logs there
With "internal syslog" you mean the Synology syslog. In the Splunk container I do not see a syslog.Yes I'm using the official splunk image with internal syslog stored on local volume (I'm using Docker on my Synology NAS).
You don't need to "look" for any Syslog in Splunk. Syslog is just 1 of many ingress channels for data into Splunk. Offcourse you need to make it possible for syslog messages to arrive in Splunk so expose some ports etc.With "internal syslog" you mean the Synology syslog. In the Splunk container I do not see a syslog.Yes I'm using the official splunk image with internal syslog stored on local volume (I'm using Docker on my Synology NAS).
Yes I'm using the official splunk image with internal syslog stored on local volume (I'm using Docker on my Synology NAS).
Here is my config:You have to use host network (--net host) or macvlan, otherwise you will not see the single client's ip but the natted address. If you don't want use --net host you need to correctly map the ports.Code: Select alldocker run -d --net host -v /volume3/docker/Splunk/etc:/opt/splunk/etc -v /volume3/docker/Splunk/var:/opt/splunk/var -v /etc/localtime:/etc/localtime:ro -e "SPLUNK_START_ARGS=--accept-license" -e "SPLUNK_PASSWORD=Password" --name splunk splunk/splunk:latest
index=*
i need logs to disk because, again, were having trouble with my connection, my isp need to see the logs, and memory log is too small, that's why we send them to disk, so they can analize over the course of 4 or 5 days and do what they need to do to fix our issues, if i deny, they wont fix anything, until i send them the logs.The point with the script is to send all information using syslog. If you selet that log should be sent to disk, it will also go there. As far as I know, you can not split the logg saying that some should go to disk, some to memory and some to disk.
I still do not understand why you need logs to disk. Its 10 times better to get all to Splunk, and then analyse what you are looking for there. Disk is a limited resource on the routers so it will fill up quickly.
You do tell that all info log should go to the disk as well.add action=disk1 topics=critical
add action=disk1 topics=error
add action=disk1 topics=info
All message need to be tagged "MikroTik", so message should look like this using this search: index=* (section 2b)Did this solution work with splunk linux docker version as well ? In my case, splunk receives mikrotik syslog data but in this plugin shows no devices
You can also try this search:dns MikroTik: done query: #3083521 dns name does not exist
index=* | eval status=if(match(_raw, "MikroTik"), "ok", "error") | stats count by host status
/system logging
add action=logserver prefix=MikroTik topics=dhcp
add action=logserver prefix=MikroTik topics=!debug,!dns
Perhaps some more tuning parameters to consider.Dear Sir,
Thanks for Tool. I get below error (log/splunkd.log) and after that logging stopped.
WARN DateParserVerbose - Failed to parse timestamp in first MAX_TIMESTAMP_LOOKAHEAD (32) characters of event. Defaulting to timestamp of previous event (Thu Dec 17 04:11:00 2020). Context: source=udp:514|host=xxx.xxx.xxx.x|syslog|
Thanks for your help.
EDIT
I add two below lines under [syslog] in etc/apps/MikroTik/default/props.conf and problem solved till now :-)
MAX_TIMESTAMP_LOOKAHEAD = 23
DATETIME_CONFIG = CURRENT
The AD DNS did not forward clients name (all clients are the domain name) so I want keep MikroTik DNS logs and exclude domain DNS logs.You could try this:
To exclude DNS logs from MT.Code: Select all/system logging add action=logserver prefix=MikroTik topics=dhcp add action=logserver prefix=MikroTik topics=!debug,!dns
Hi Jotne,
An error in the script was found.All devices run fine with SNTP but why does splunk signal that SNTP is not correct ?
# Get NTP status
# ----------------------------------
:do {
:log info message="script=ntp status=$([/system ntp client get status])"
} on-error={
:if ([:len [/system ntp client get last-update-from]]>0) do={
:log info message="script=ntp status=synchronized"
} else={
:log info message="script=ntp status=not-synchronized"
}
}
/system logging add action=logserver prefix=MikroTik topics=!debug,!packet
/system logging add action=logserver prefix=MikroTik topics=!debug,!packet,!snmp
2b) Then select what modules to log.
I do suggest that you send all DHCP logs including debug and all other logs that are not debug.
It is very important to name the prefix like this "MikroTik" and not "mikrotik" or some other.
Splunk uses the MikroTik prefix to find out what type of syslog data that is coming to it.
Uppercase T and uppercase M, rest are lowercase
Web gui:
System->Logging->Rules->Add new->Topics:dhcp->Prefix:MikroTik->action:your syslog server->Ok
System->Logging->Rules->Add new->Topics:!debug->Prefix:MikroTik->action:your syslog server->Ok
System->Logging->Rules->Add new->Topics:!debug,!packet,!snmp->Prefix:MikroTik->action:your syslog server->Ok
Then clearly a bug on the RouterOS of that box ?Like the devil is playing with it.
5 minutes after I wrote the previous post the HAPac2 stopped again with sending log data to Splunk.
Yesterday it lasted 2,5 hours today 3 hours. So I have made little progress :(
4/16/21 12:01:06.000 PM system,info MikroTik: log action changed by admin
host = 192.168.0.8 source = udp:1514 sourcetype = mikrotik
Is there a way to not log the "firewall logs" into the memory without disabling system logging? I need system logging for info/debug/errors like interfaces going down etc.To not fill up internal logs with firewall logs etc, turn off info log to memory (max 999 lines) /system logging set 0 disabled=yes PS Hotspot is not needed if you do not use it.
Thanks, that works well and makes more sense than disabling it completely, I'd suggest putting that in the original guidepost itself.You can try to enable info logging and add that firewall should not be included, like this:
.
logging.jpg
A good Ide, I will add that.I'd suggest putting that in the original guidepost itself.
Since MikroTik does not support TLS syslog (please add), the only workaround I do see is to send log to a local Rsyslog (with TLS support) that sends it to an external Syslog server using TLSWhat can I do to ensure MikroTik to Splunk Server communication is encrypted and not sent in plaintext?
You can set up Splunk to use HTTPS or add a proxy server (HAProxy) in front. Create a read only user that only sees that dashboard.Is there a secure (HTTPS) way for me to expose the Live Attack Dashboard on my site?
The external Syslog setup looks complicated to me, with too much overhead.A good Ide, I will add that.I'd suggest putting that in the original guidepost itself.
Since MikroTik does not support TLS syslog (please add), the only workaround I do see is to send log to a local Rsyslog (with TLS support) that sends it to an external Syslog server using TLSWhat can I do to ensure MikroTik to Splunk Server communication is encrypted and not sent in plaintext?
https://medium.com/poka-techblog/securi ... 862326c154
You can set up Splunk to use HTTPS or add a proxy server (HAProxy) in front. Create a read only user that only sees that dashboard.Is there a secure (HTTPS) way for me to expose the Live Attack Dashboard on my site?
You can also make Splunk send data (eks. each 5 min) to annoter web site. (Have not tried this)
Also look at Rest API or Embed scheduled reports
I have naver seen any problems with my pain text syslog, but TLS would be a good enhancement.
You can set access list on who can send syslog to your server and also monitor when you get new hosts trying to send syslog message.
One reason that I do not see many wrong attempts, is that I have a rule that blocks an IP for 24 hour if it tries one port that are not open in my router. So if some tries example SQL port 1433, he will be blocked for all port that are open as well. including syslog/web +++
Access list have around 7000 entries all time.
How would DoH encrypt Syslog's plaintext which works on IP:Port Basis after the initial DNS lookup regardless?Ahh it was that you mean. This is why I like to use DoH. I not like all inn the middle can look at all my DNS request.
You probably where too honoust when telling in what country you live ?Tried to create an account and i got a message due to US guidelines etc you have to contact us..
Nah would surprise me ;-)I was honest.
Is UK on the black list??
module=script script=resource | table _time host uptime
echo '<14>_sourcehost_ messagetext' | nc -v -u -w 0 192.168.0.50 514
host="192.168.0.10"
*
Jun 8 09:14:57 192.168.0.10_sourcehost_ messagetext
Here is how I test if syslog do sends data to Splunk server with IP 192.168.0.50
From a linux server (192.168.0.10) use the following command.Then on the Splunk web console do a search like this:Code: Select allecho '<14>_sourcehost_ messagetext' | nc -v -u -w 0 192.168.0.50 514
or justCode: Select allhost="192.168.0.10"
You should then from the test server see:Code: Select all*
If you do see nothing, syslog may not work, you have some local firewall on the server (iptables)Code: Select allJun 8 09:14:57 192.168.0.10_sourcehost_ messagetext
You should see that your Windows listening on port 514 udpnetstat -toan
PS Mikrotik app has nothing to do if you receive syslog or not.UDP 0.0.0.0:514
index=*
index=_internal
/system logging action
set 3 remote=192.168.1.0
/system logging
add action=remote prefix=MikroTik topics=account
add action=remote prefix=MikroTik topics=critical
/ip accounting
set enabled=yes threshold=2560
add action=remote prefix=MikroTik topics=account
add action=remote prefix=MikroTik topics=critical
/system logging add action=logserver prefix=MikroTik topics=dhcp
/system logging add action=logserver prefix=MikroTik topics=!debug,!packet,!snmp
/system logging add action=logserver prefix=MikroTik topics=hotspot
:put [/system health get cpu-temperature ]
18.14.45.136 Test_Router A2FFFFF71F31 RBM33G RBM33G 6.48.2 (stable) 1
:log info message="This is a test"
"This is a test"
/system logging action
add name=Splunk remote=12.15.15.14 target=remote
/system logging
add disabled=yes topics=ovpn,debug
add action=DavidServer disabled=yes topics=warning
add action=Splunk prefix=MikroTik topics=account
add action=Splunk prefix=MikroTik topics=critical
_time host user system user_ip eventtype host_name
2021-06-20 12:56:50 9.13.10.118 admin winbox 8.19.166.6 adm_user_login_failure 9.13.10.118
/system logging add action=logserver prefix=MikroTik topics=!debug,!packet,!snmp
/system logging add action=logserver prefix=MikroTik topics=dhcp
/system logging add action=logserver prefix=MikroTik topics=!debug,!packet,!snmp
/system logging add action=logserver prefix=MikroTik topics=hotspot
add action=logserver prefix="MikroTik: sys=22" topics=dhcp
add action=logserver prefix="MikroTik: sys=22" topics=!debug,!packet
add action=logserver prefix="MikroTik: sys=22" topics=hotspot
SEVERE 05/07 06:24:06 wrong message: 3.13.12.118 <27>Jul 5 09:24:06 Router script error: error - contact MikroTik support and send a supout file (2)
The whole app with field extraction etc are based on this tag, so If that changes or are removed, lots of the stuff inn the app must be rewritten.system,info,account MikroTik: sys=22: user hidden logged out from 1.2.3.4 via winbox
My Splunk host (=VM) just resolves these.Thank you so much Jotne this is an amazing tool you put together!
I am new to Mikrotik, just got the router 2 weeks ago.
I am wondering how you guys get the hostname to show in the screenshots? I have the IP address instead?
Some scripts run only once every day, so if you wait one day, it should be ok.I am wondering how you guys get the hostname to show in the screenshots? I have the IP address instead?
docker stop splunk-server
docker rm splunk-server
docker run -d \
-p 8000:8000 \
--name splunk-server \
-v /data/syslog/udp:/data/syslog/udp \
-v /data/syslog/tcp:/data/syslog/tcp \
-v /data/splunk/etc:/opt/splunk/etc \
-v /data/splunk/var:/opt/splunk/var \
-v /etc/localtime:/etc/localtime:ro \
-v /etc/hosts:/etc/hosts:ro \
-v ~/conf/input.conf:${SPLUNK_HOME}/etc/apps/MikroTik/default/input.conf \
-e SPLUNK_START_ARGS='--accept-license' \
-e SPLUNK_PASSWORD='XXXXXXXXXXX' \
--restart always \
splunk/splunk:latest
:local hour [:pick ([/system clock print as-value ]->"time") 0 2]
:local hour [:pick [/sys clock get time] 0 2]
:foreach logline in=[/ip firewall nat find dynamic=yes] do={
:foreach logline in=[/ip firewall nat find where dynamic=yes and comment~"^upnp "] do={
:if (([/system health get]~"state=disabled" || [/system health get]="")=false) do={
:if (!([/system health get]~"(state=disabled|^\$)")) do={
This I do not understand. Can there be other dynamic nat than upnp lines, and why should I include the comments test.:foreach logline in=[/ip firewall nat find where dynamic=yes and comment~"^upnp "] do={
/ip firewall nat> pri Flags: X - disabled, I - invalid, D - dynamic 0 D chain=dstnat action=jump jump-target=hotspot hotspot=from-client 1 D chain=hotspot action=jump jump-target=pre-hotspot 2 D chain=hotspot action=redirect to-ports=64872 protocol=udp dst-port=53 3 D chain=hotspot action=redirect to-ports=64872 protocol=tcp dst-port=53 4 D chain=hotspot action=redirect to-ports=64873 protocol=tcp hotspot=local-dst dst-port=80 5 D chain=hotspot action=redirect to-ports=64875 protocol=tcp hotspot=local-dst dst-port=443 6 D chain=hotspot action=jump jump-target=hs-unauth protocol=tcp hotspot=!auth 7 D chain=hotspot action=jump jump-target=hs-auth protocol=tcp hotspot=auth 9 D chain=hs-unauth action=return dst-address=179.44.232.13 10 D ;;; www.paypal.com chain=hs-unauth action=return dst-address=2.17.140.171 11 D ;;; www.paypal.com chain=hs-unauth action=return dst-address=2.20.40.117 [...]
# from
:set ( $array->$listname ) 1
[...]
:foreach k,v in=$array do={
# to
:if (!($array ~ $listname)) do={ :set array ($array , $listname) }
[...]
:foreach k in=$array do={
# only k without v
if ([/ip accounting get enabled]=yes) do={
if ($listdynamic = true) do={
if ($i = $cmd) do={:set $f 1}
if ($f<>1) do={
foreach logline in=[/ip accounting snapshot find] do={
foreach i in=[/system history find] do={
:do {
:if ([:len [/caps-man registration-table find]] > 0 and $CAPsMANN) do={
}
} on-error={}
:if ( ([:len [/interface find where type="cap"]] > 0) and $CAPsMANN) do={ /system script run capsman }
:do {
} on-error={
:if ([:len [/system ntp client get last-update-from]]>0) do={
:log info message="script=ntp status=synchronized"
} else={
:log info message="script=ntp status=not-synchronized"
}
}
:local ntpstatus ""
:if ([:len [/system package find where !disabled and name=ntp]] > 0) do={
:set ntpstatus [/system ntp client get status]
} else={
:if ([:typeof [/system ntp client get last-update-from]] = "nil") do={
:set ntpstatus "using-local-clock"
} else={
:set ntpstatus "synchronized"
}
}
:log info message="script=ntp status=$ntpstatus"
# *** missing : on do {
# Get uncounted data
do {
/ip accounting uncounted {
# *** remove $ from first $value in front of ":set"
:set $value [:pick $value 0 $newline]
:if ([:tonum [:pick [/system resource get version] 0 1]] > 6 and $CmdHistory) do={
# v missing : on both global and local
:global cmd
:local f 0
:foreach i in=[/system history find] do={
# v missing : on both if v removed $ from $f
:if ($i = $cmd) do={ :set f 1 }
# v v replaced <> with != but not really an error if v7 accept <>
:if ($f != 1) do={
:log info message="StartCMD"
:log info message=[/system history get $i]
:log info message="EndCMD"
}
}
# v missing : v missing /
:global cmd [:pick [/system history find] 0]
}
[/ip firewall nat find where dynamic=yes and comment~"^upnp "]
[/ip firewall nat find where dynamic=yes and chain="hotspot"]
[/ip firewall nat find where dynamic=yes and chain="hs-unauth"]
Fixed now@ jvanhambelgium
Some script runes only once a day and since some part is changed to use KV store, it may take a day before all is populated.
if no data, try:index=* sourcetype=mikrotik
if no data tryindex=* host=<ip of your router>
index=*
But this is oksourcetype=MikroTik
If you user is part of the admin role, try this:index=* sourcetype=MikroTik
You can see the MikroTik tag. For me it seem that you do not have it in your logs.script,info MikroTik: script=pool pool=DHCP-Pool-vlan20-Guest used=50 total=190
script,info MikroTik: script=pool pool=VPN-pool used=0 total=18
script,info MikroTik: script=pool pool=DHCP-Pool-vlan1-Home used=252 total=455
script,info MikroTik: script=neighbor nid=3 version="6.48.1 (stable)"
script,info MikroTik: script=neighbor nid=3 uptime="05:07:14"
What do you see with this:/system logging add action=logserver prefix=MikroTik topics=dhcp
/system logging add action=logserver prefix=MikroTik topics=!debug,!packet,!snmp
/system logging add action=logserver prefix=MikroTik topics=hotspot
index=* host 192.168.1.126 | table index host sourcetype source _raw
My bad - It is a case of RTFM. I did not put the MikroTik prefix in the action.Here is how data looks in my logs in Splunk
You can see the MikroTik tag. For me it seem that you do not have it in your logs.script,info MikroTik: script=pool pool=DHCP-Pool-vlan20-Guest used=50 total=190
script,info MikroTik: script=pool pool=VPN-pool used=0 total=18
script,info MikroTik: script=pool pool=DHCP-Pool-vlan1-Home used=252 total=455
script,info MikroTik: script=neighbor nid=3 version="6.48.1 (stable)"
script,info MikroTik: script=neighbor nid=3 uptime="05:07:14"
Its set in section 2bWhat do you see with this:/system logging add action=logserver prefix=MikroTik topics=dhcp
/system logging add action=logserver prefix=MikroTik topics=!debug,!packet,!snmp
/system logging add action=logserver prefix=MikroTik topics=hotspotCode: Select allindex=* host 192.168.1.126 | table index host sourcetype source _raw
and it need to be presentNormal its problem that the tag is wrong.
It need to be MikroTik with uppercase M and T
Is this file corrupted just for me or everyone else?Version 3.3 13.08.2021
1g) Download the Splunk spl file:
MikroTik3.3.rar
08/09/2021 09:27:49.022 2021-09-08T09:27:49.022737+02:00 router.lan dhcp,debug,packet MikroTik: Client-Id = 01-08-55-31-17-BD-8F
dhcp,debug,packet MikroTik: dhcp-alert on Bridge1 sending discover with id 3480279547 to 255.255.255.255